Part I: Work with what you’ve got
In the first in a series of posts designed to help demystify the dark arts of data analytics, we take a look at how to approach problem solving with data.
‘Big data’, ‘machine learning’, there are so many buzzwords around the field of data analytics that if you’re new to the concept, it can seem bewildering. But with more and more businesses realising its potential, it’s worth getting to grips with the basics. Even if you’ve no plans to become a Data Guru, it could still help you in your next job search
What do you want to discover?
Before you start working with data, you’re going to need some tools. There are a wide range of data analytics platforms out there, ranging from the simple to uber-customizable enterprise Business Intelligence systems. Luckily, most rely on simple point-and-click actions, so all you have to think about is what you want to discover, and which information will set you on the right path. Discoveries could be as simple as finding a data match to a specific question, or more advanced, such as predicting a customer’s future behaviour.
Zoom in
Once you know what you want to find out, and have a platform to work with, it’s time to dive in. The main pool of data you’ll be using is called your ‘dataset’. This is essentially like a huge spreadsheet made up of columns (fields) and rows (observations).
There are several ways you can play with this data to make sense of it, but one of the simplest processes for data analytics is the 4-step pipeline below.
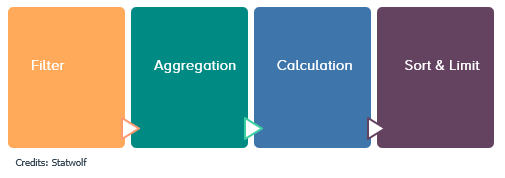
Step 1 - Filtering is the stage where a subset of the dataset is selected based on the analysis parameters. This could mean restricting the analysed portion of the dataset to a specific timeframe, or to a certain subset.
Step 2: - Aggregation (or grouping) is the stage where the observations that survived the filtering stage are divided into a number of homogeneous groups based on the requested dimensions.
Step 3 - Calculation happens during this stage, the requested metrics are calculated for each of those groups.
Step 4 - Sort & limit is the stage that defines the order in which the result set is returned to the user, as well as its size.
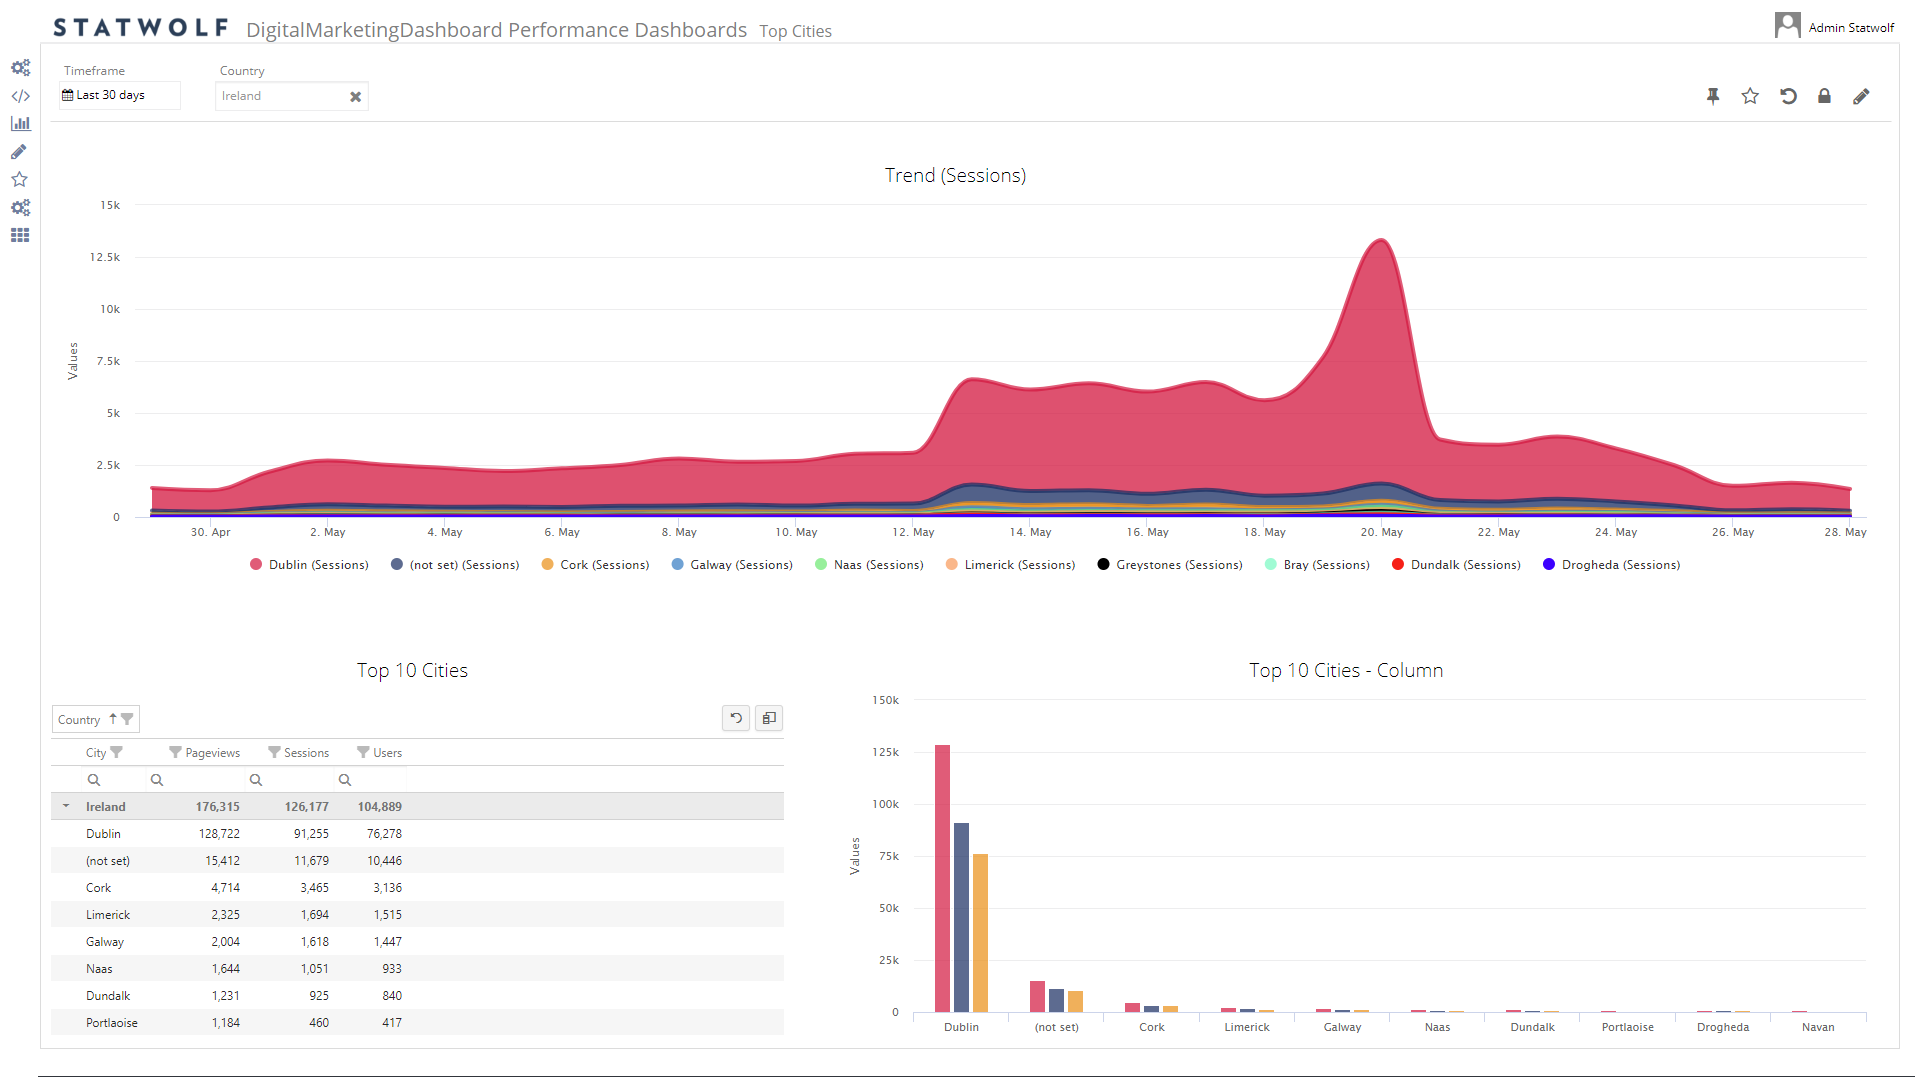
Confused? If this is too abstract for you, don’t worry – we’ve got you covered. Let’s translate some real-life examples onto the aggregation pipeline. For instance, let’s look at the top 10 cities in Ireland where visitors to our website came from in the past 30 days.
Let’s break it down:
What are the
top 10
cities
in Ireland
by number of
visitors to our website
in the last 30 days?
So here we are requesting one dimension (break my result up by city), one metric (for each city, give me the number of visitors) and we are restricting our analysis to a specific timeframe (the last 30 days) and set of locations (country equals Ireland). Finally, we are instructing the system to sort our result from the cities with most visitors to the least, and to only return the top 10 rows.
When asked, here’s what the Statwolf analytics platform had to say, demonstrating a clear picture of where our main target market is.
The four-step pipeline above is essentially how most data analysis programs approach problem solving. But like any machine, they’re only as good as the instructions you give them. That’s why it’s so important to think clearly about the problems you want to solve, and the information you have available to you.
Of course, if you need some advice on a data analysis strategy, we’d be happy to help hello@statwolf.com